
Your tacks are losing you more speed than you think
Every tack is a speed trade-off. Most riders accept the loss without knowing how big it is. Here's why that matters — and what Waterspeed's tack and gybe analysis shows you instead.
You know that feeling when you come out of a tack slower than you went in? Everyone does. You feel it in the board, in the sail, in the gap between where you thought you'd be and where you actually end up.
But "slower" is vague — and vague doesn't help you improve your tack technique in windsurfing, wingfoiling, or any other water sport where turns decide the session.
The real question isn't whether you're losing speed in the transition. You always are. The question is: how much, why, and what's actually causing it.
That's what Waterspeed's tack and gybe analysis is built to answer.
What's actually happening in a tack — and what the data captures
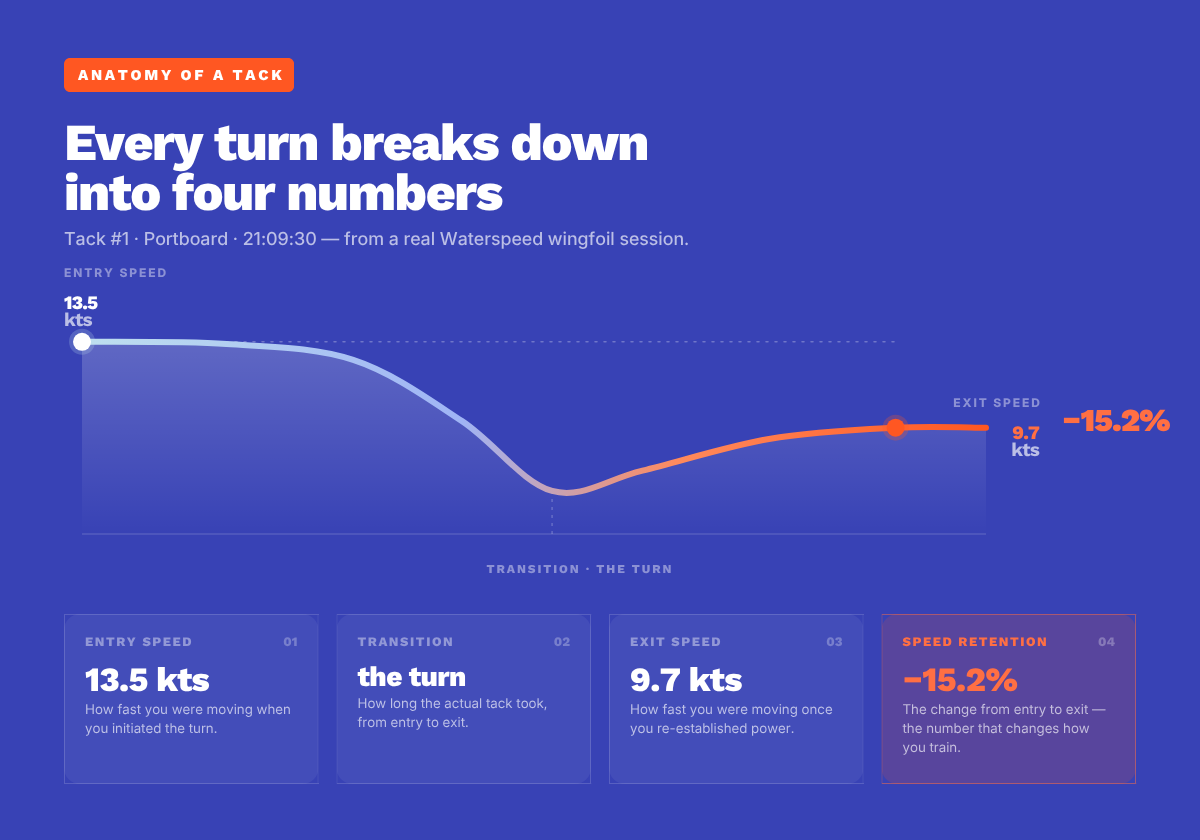
A tack isn't one moment. It's a sequence — and each part of that sequence has its own data footprint.
Waterspeed automatically breaks down every tack and gybe in your session into four core measurements:
Entry speed — how fast you were moving when you initiated the turn
Transition time — how long the actual tack took from entry to exit
Exit speed — how fast you were moving when you re-established power
Speed retention % — the ratio of exit speed to entry speed, expressed as a percentage
That last number — speed retention — is the one most riders have never seen before. And it's the number that changes how you train.
A 45% speed retention means you came out of your tack with less than half the speed you went in with. A 72% means you held more than two-thirds. The difference between those two numbers, compounded across every tack in a race or a long session, isn't small.
The gap between what riders think is happening and what the data actually shows is almost always larger than expected. Most riders who feel like they're tacking "okay" are retaining far less speed than they assume — because the feeling of rebuilding speed after the transition masks how much was lost in it.
The two types of tack problems
Once you start reading your tack data, most issues fall into one of two categories. Knowing which one you're dealing with saves you from training the wrong thing.
Entry angle and timing issues
This is about what happens before the tack even begins. Common entry problems include:
Coming into the tack with too much or too little speed, reducing the window for a clean transition
Poor point of sail on entry — too close to the wind, or too far off, making the transition awkward
Initiating the tack too early or too late relative to a mark or position
In Waterspeed, entry problems show up as inconsistent entry speeds across tacks in the same session. If your entry speed varies wildly — say, between 12 and 22 knots across five tacks in similar wind — that's an entry timing and setup problem, not a technique problem in the transition itself.
Exit and rebuild issues
This is what happens after the tack — how quickly you re-establish power and return to speed. Common exit problems include:
Slow or mistimed sail handling during the transition
Hesitation in the exit stance
Losing momentum before fully re-engaging with the wind
Exit problems show up in Waterspeed as low speed retention percentages even when your entry speed was good. Your entry was clean, your transition time was reasonable — but you came out slow. That points to the exit, not the setup.
Separating these two problems is what makes tack data genuinely useful. Without it, you're adjusting things at random.
What good tack data looks like
There's no single benchmark that applies to every sport, every wind condition, or every rider level. But here are some general reference ranges that give you a sense of what to aim for:
Windsurfing (recreational to intermediate): 40–65% speed retention in moderate wind
Wingfoiling: highly variable depending on foil and conditions, but riders working on tack technique typically see retention in the 35–60% range
Sailing (dinghy/keelboat): transition times and retention vary significantly by boat class, but consistency across tacks is a strong indicator of technique
More important than any single number is consistency. A rider with 55% retention on every tack is in a stronger position than one averaging 65% with swings between 30% and 80%. Consistency is what's coachable, and consistency is what Waterspeed tracks.
Here's what this looks like in practice — from a real Waterspeed wingfoil session. Three tacks, all in similar conditions, all within two minutes of each other:
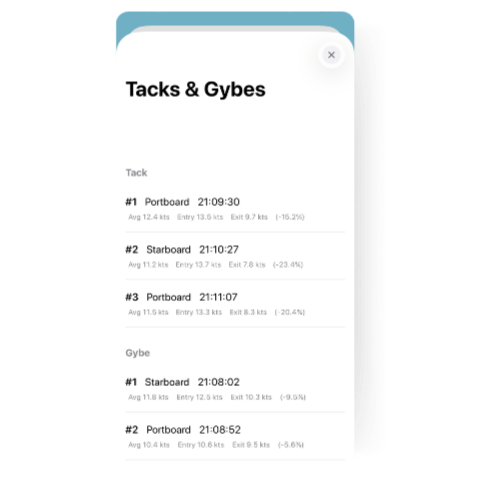
Tack #1: Entry 13.5 kts → Exit 9.7 kts — 15.2% speed loss
Tack #2: Entry 13.7 kts → Exit 7.8 kts — 23.4% speed loss
Tack #3: Entry 13.3 kts → Exit 8.3 kts — 20.4% speed loss
Three tacks. Same rider. Same session. Almost identical entry speeds — but exits ranging from reasonable to significant. That's not a wind problem or a conditions problem. That's a consistency problem, and specifically a tack #2 problem worth isolating and working on.
Without Waterspeed, this rider finishes the session knowing they tacked three times. With it, they know exactly which tack to replay in their head on the drive home — and what to fix next time on the water.
New to the Tacks & Gybes feature? Here's a quick guide on how to set it up and get the most out of it → How to use Tacks & Gybes in Waterspeed
How to use waterspeed to actually improve
The data only works if you use it with intention. Here's a simple routine that makes tack analysis a real training tool, not just a number you scroll past.
After every session, review your last 5 tacks. Not the whole session — just five. Look at entry speed, transition time, exit speed, and retention. Get familiar with your baseline before you try to change it.
Look for consistency, not just your best case.Your best tack of the session isn't your average tack. Your average tack is the one that costs you in races and longer sessions. Focus on bringing your worst tacks closer to your best, not on celebrating the outlier.
Set one specific target and track it across sessions. Don't try to fix everything at once. If your retention is averaging 48%, aim for 55% over the next three sessions. Track it explicitly. Adjust one thing at a time — entry timing, exit stance, sail handling — and read the data to see what moved.
Use session comparison to measure progress.Waterspeed lets you compare sessions side by side, which means you can track how your tack metrics evolve over weeks, not just in a single outing. This is where improvement becomes visible and motivating rather than just theoretical.
The turns are where sessions are decided
Your top speed gets all the attention. It's the number people share, the number that shows up in challenge leaderboards, the number that feels impressive on a screenshot.
But most of your races and your sessions are decided in the turns. A few knots of top speed mean little if you're bleeding 40% of your momentum every time you change direction.
Start reading your tack data after your next session. It'll show you exactly where to focus — and exactly how much you've been leaving on the water without knowing it.
Already using Waterspeed? Find your tack and gybe breakdown in the session detail view after your next outing.